
Exponential Moving Average (EMA)
The Exponential Moving Average (EMA) is a type of moving average that gives more weight to recent prices, making it more responsive to new information compared to the Simple Moving Average (SMA).
How to interpret this page.
- EMA is most widely used technical indicator by the traders to identify the trend direction and potential support and resistance levels.
- Below are the options that are provided in "strikofno.in"
- Price Crossing above 5EMA: This provides list of stocks whose price has clossed above their 5-day EMA
- Price Crossing above 20EMA: This provides list of stocks whose price has clossed above their 20-day EMA
- Price Crossing above 50EMA: This provides list of stocks whose price has clossed above their 50-day EMA
- Price crossing below 5EMA: This provides list of stocks whose price has crossed below their 5-day EMA
- Price crossing below 20EMA: This provides list of stocks whose price has crossed below their 20-day EMA
- Price crossing below 50EMA: This provides list of stocks whose price has crossed below their 50-day EMA
- EMA5 crossing EMA20: This provides list of stocks whose 5-day EMA has crossed above or below their 20-day EMA
- EMA20 crossing EMA50: This provides list of stocks whose 20-day EMA has crossed above or below their 50-day EMA
- EMA5 crossing EMA50: This provides list of stocks whose 5-day EMA has crossed above or below their 50-day EMA
- Price Near 5_EMA: This provides list of stocks whose price is near their 5-day EMA
- Price Near 20_EMA: This provides list of stocks whose price is near their 20-day EMA
- Price Near 50_EMA: This provides list of stocks whose price is near their 50-day EMA
- As this is techical indicator for underlying stock, all pain points are plotted along with stock.
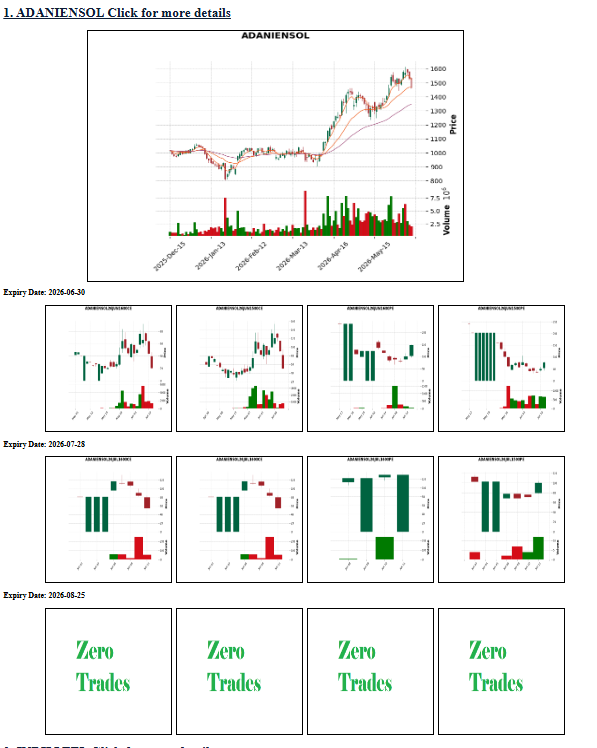
- In above figure, price has crossed EMA5. Ather 6 plots, show how this price action is interpreted. using max pain points at various expiries.
- EMA indicator is useful if combined with multiple EMAs
This page is useful for traders using EMA for their trading decisions. It provides a quick overview of stocks that have recently crossed their EMA levels, which can be potential trading signals.
Disclaimer
Source : NSE BHAVCOPY