
Site explaination graph
This page will summarize overall behaviour of the stock. Details are explained below.
This page is divided into five sections.
- Site graph.
- Open Interest and OI spread graph.
- OI at different strike prices.
- Change in OI, volume and prices at different strike prices.
- Max pain at different expiries
Site Graph
- This sections provides candlestick chart of stock. This includes volume data and EMA(5,20,50).
- Traders can do basic analysis using this chart and can be used to co-related with further graphs on page.
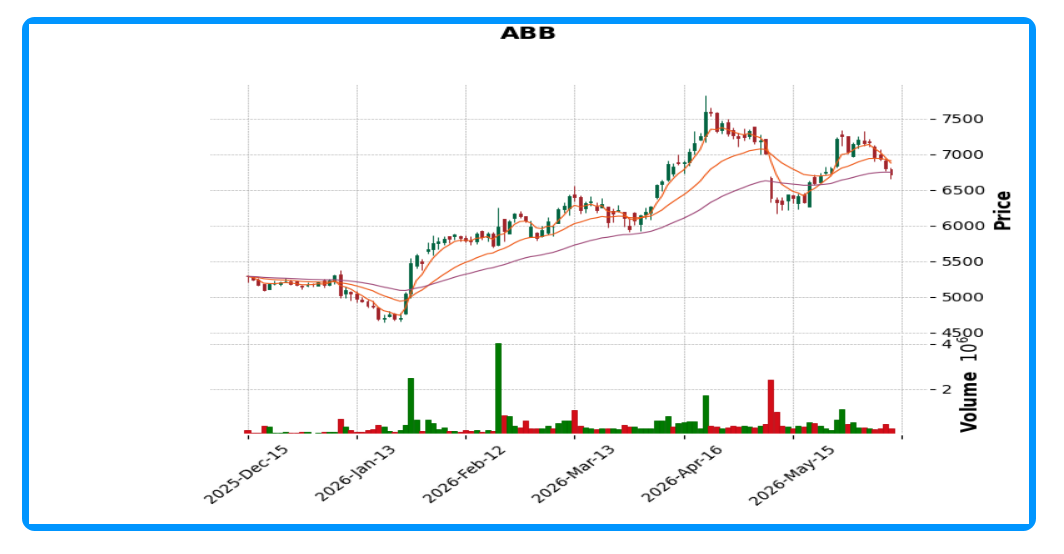
- We will take example of ABB in this whole section.
Open Interest and OI spread graph
- This section gives 2 graphs. OI at various strike prices and OI spread across different strike prices.
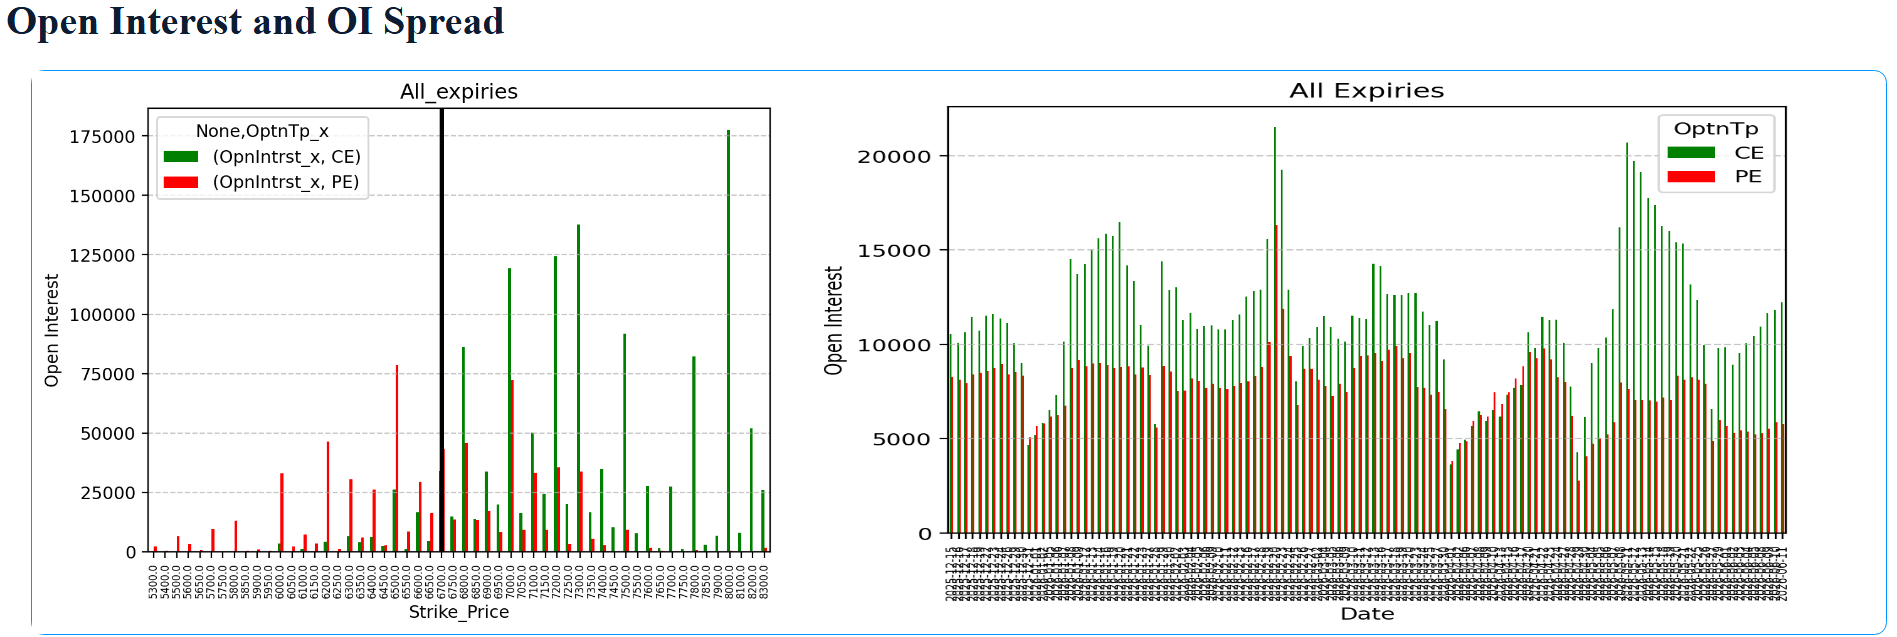
- Left graph is OI spread on that trading day.Green graph is for CE while red graph is for PE.
- Right graph shows how the OI is distributed from last 3 months.
- Traders can use this graph to understand where the OI is concentrated and how it is changing over time.
OI at different strike prices
- This section further divides OI from above section into various expiry dates.
- OI spread is shown for each expiry date.
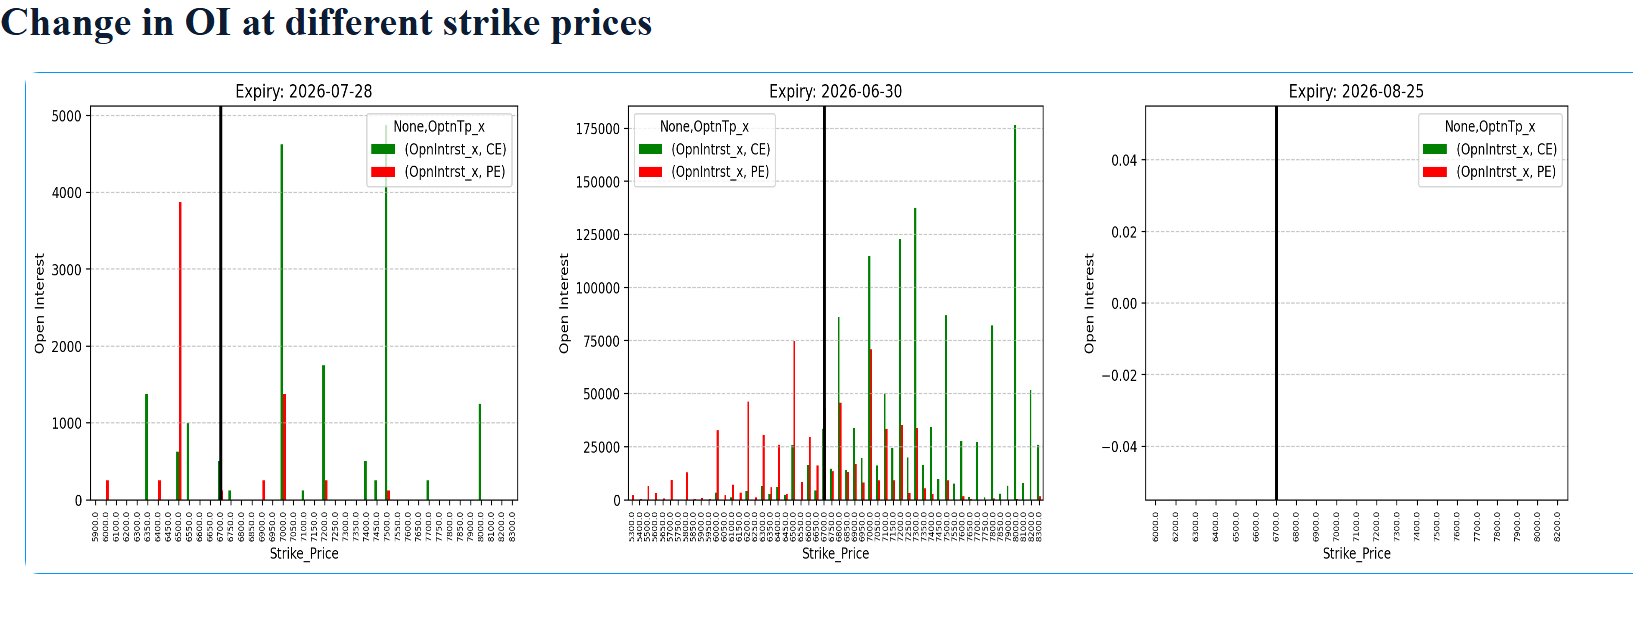
- Traders can use this graph to understand the distribution of OI in various expiry dates.
- Using this info traders can decide under which expiry date to trade.
Change in OI, volume and prices at different strike prices
- This is very important section.
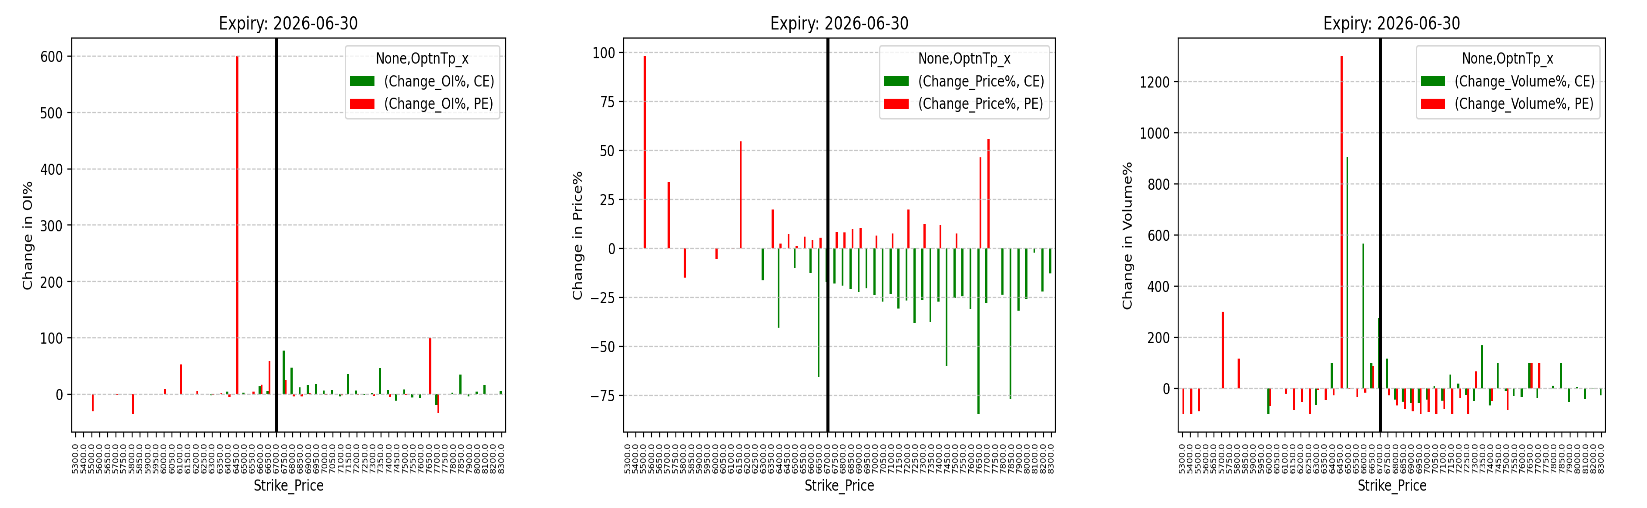
- Left graph shows Change in OI for expiry of 30th June.
- Center graph shows change in price in % for expiry of 30th june.
- In this example, we can see price of all PE contracts had increased while that of CE contracts have decreased.
- Right graph shows change in volume in % at different strikes.The increase in PE volume can be seen here.
- This section explains the dynamics of OI, volume, and prices across different strike prices and expiry dates in single line
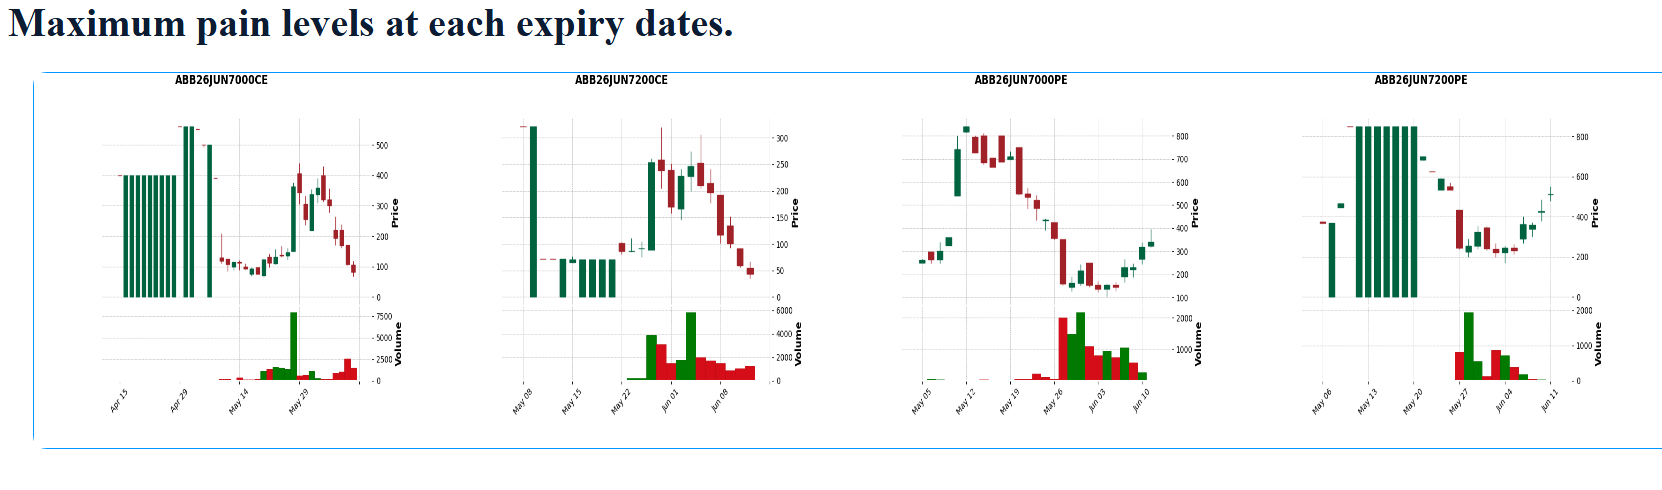
Max pain at different expiries
- This section gives max pain price for different expiry dates.
- Max pain is the price at which the maximum number of options contracts will expire worthless. It is calculated based on the open interest of call and put options at different strike prices.
- Traders can use this information to understand where the market might gravitate towards as the expiry date approaches, as it can indicate potential support or resistance levels.
This page is useful to get all information required for trading in certain FNO in one place. It gives overall picture of the stock and helps traders to take informed trading decisions.
Disclaimer
Source : NSE BHAVCOPY