Explaination:
- This page provides detailed view of stock.
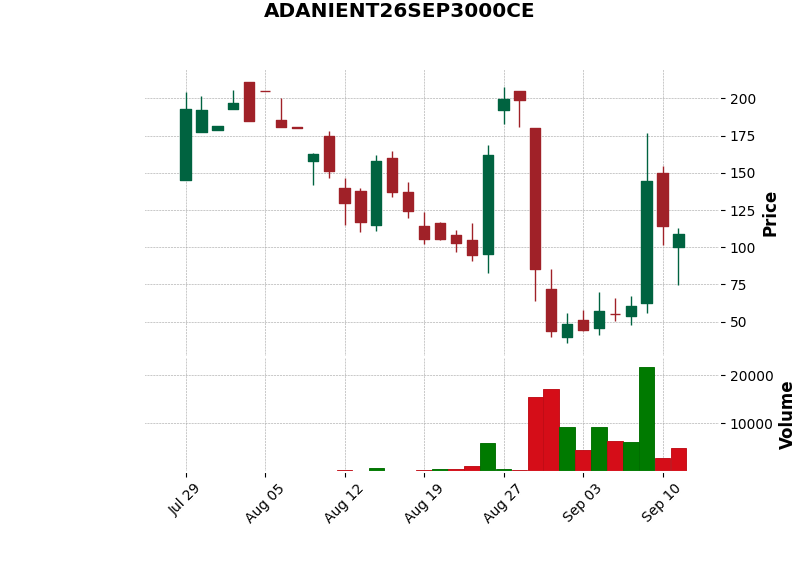
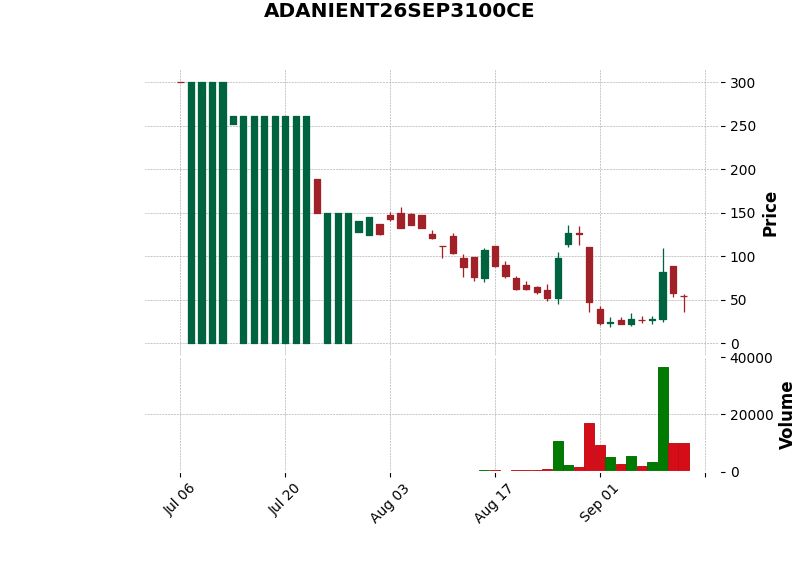
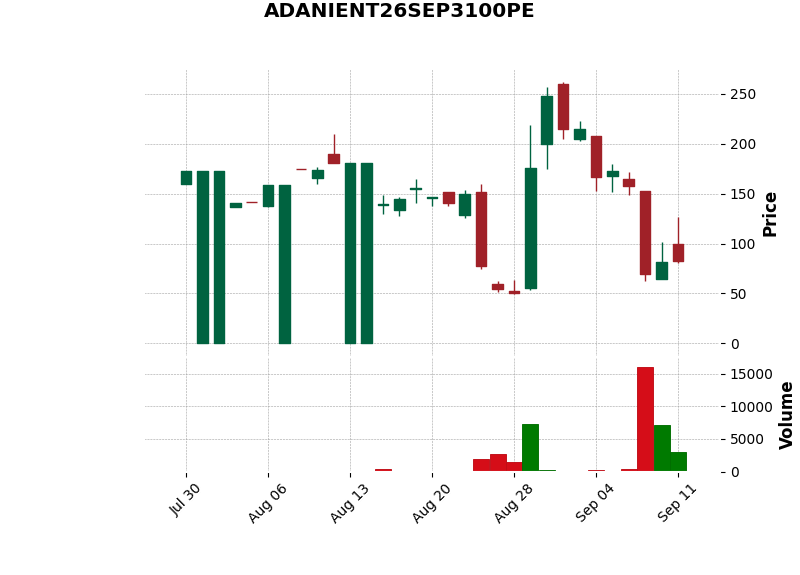
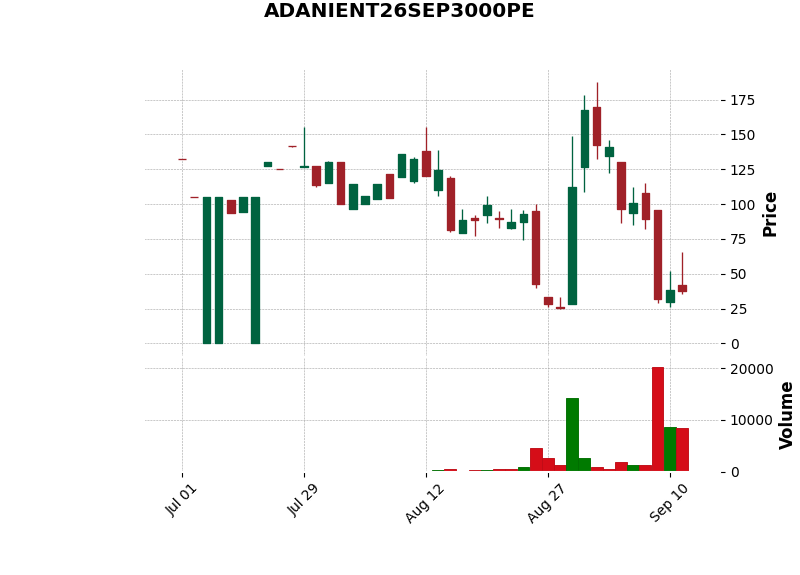
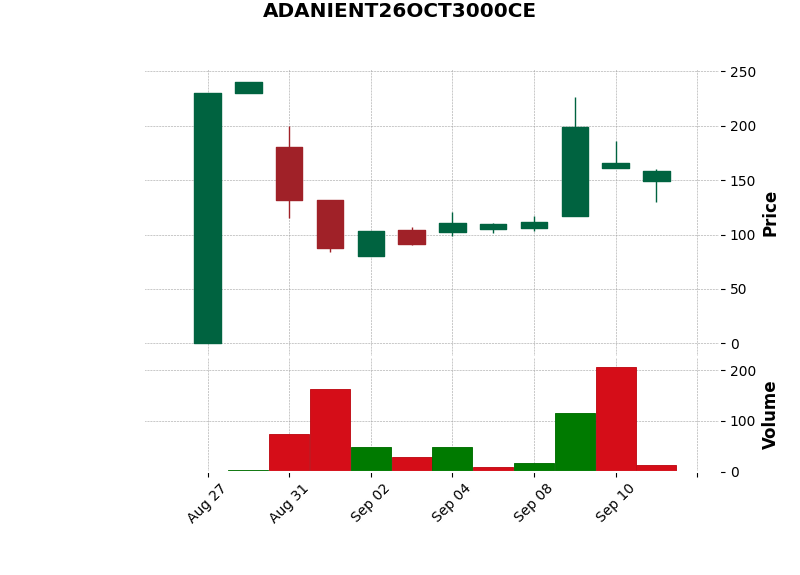
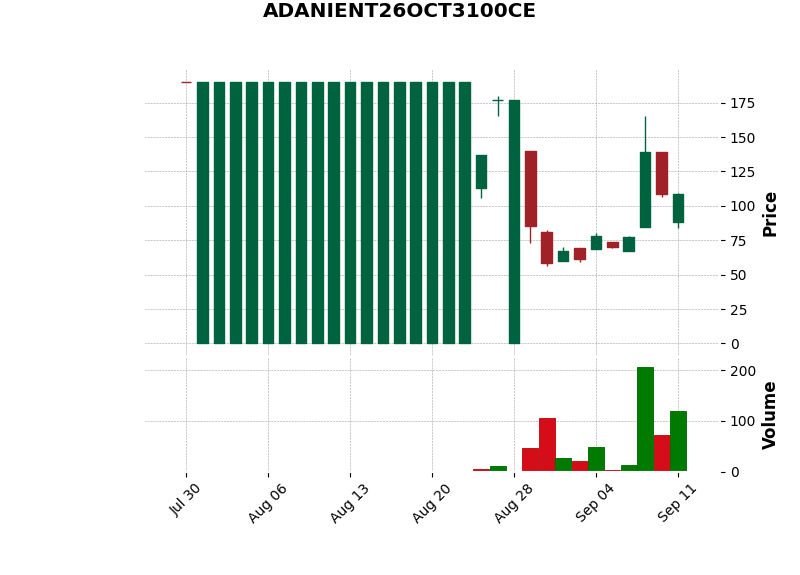
- First graph shows the stock price movement.
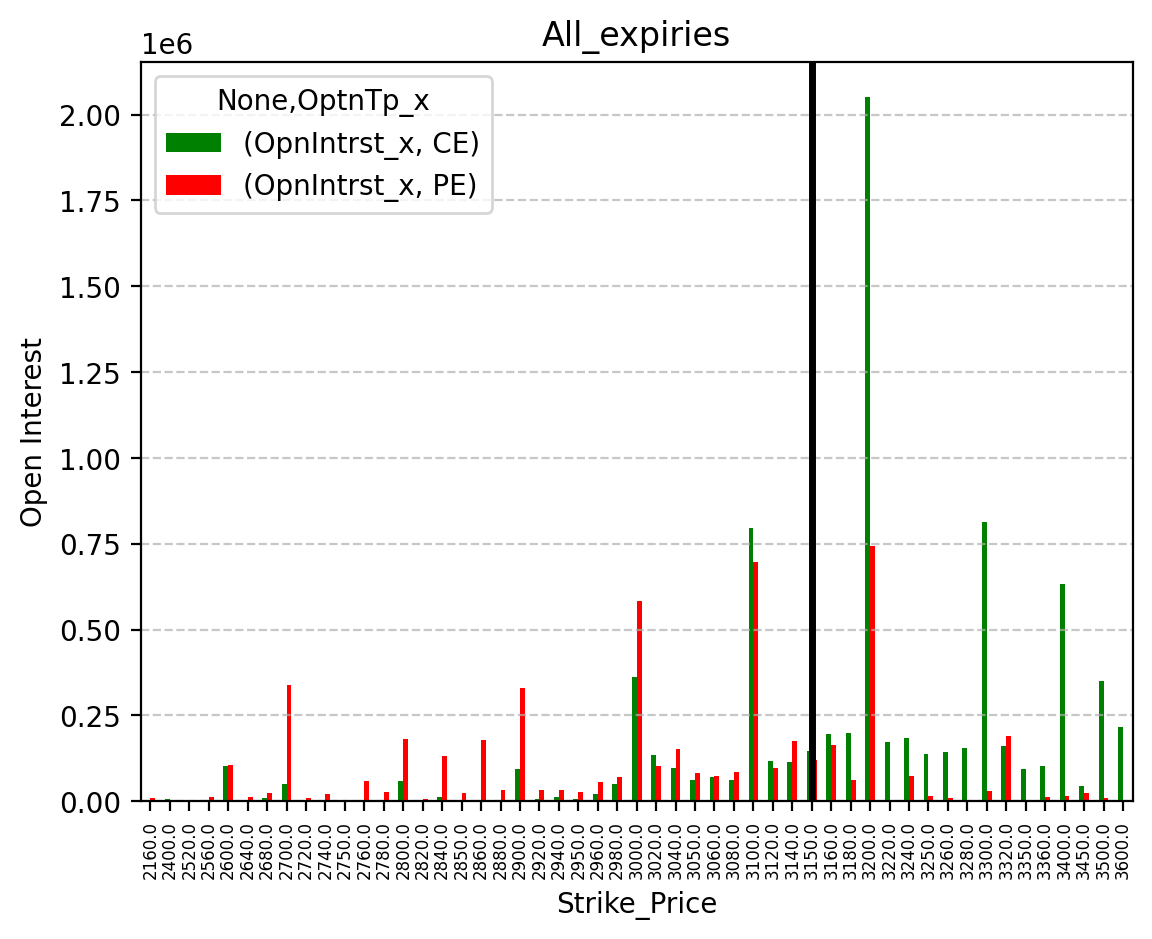
- Second graph shows the open interest and OI spread for all strike prices.
- Third graph shows the change in OI at different strike prices.
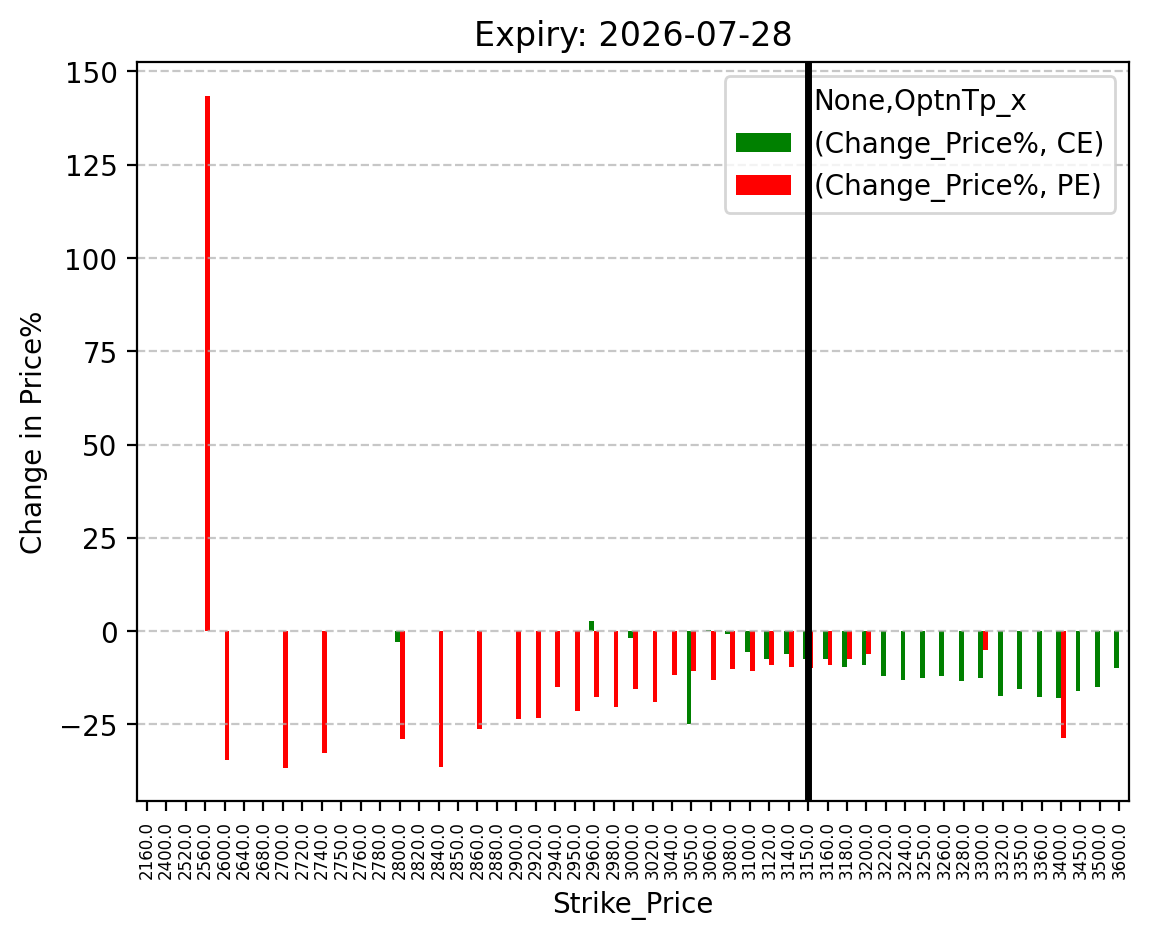
- Fourth graph shows the change in OI, Volume and price at different strike prices.
- Fifth graph shows the maximum pain levels at each expiry dates.
Click here to learn more about this page.
Stock Graph
Open Interest and OI Spread
Change in OI at different strike prices
Change in OI, Volume and price at different strike prices
Maximum pain levels at each expiry dates.
Last updated on: 2026-05-08.
Source : NSE BHAVCOPY